Welcome to Retail Shrink Reporting Week
With the USA NRF Loss Prevention Trade Event taking place this week, it is time to revisit the new Sensormatic Global Retail Shrink Index published earlier this year. Covering 14 countries representing 73% of global GDP and 80% of global retail sales, it is the authoritative document on worldwide loss prevention trends.
In 2017-2018, the cost of retail shrinkage was $99.56 billion for the countries surveyed. This post focuses on my two favorite charts from the entire study.
Highest Shrink Rates Across Verticals and Countries 2017-2018
Below chart summarizes the highest shrink by verticals by country. The gold medal goes to China in Drugstores, silver to Mexico in Office Equipment, and bronze to Italy in Home & Gardens stores.
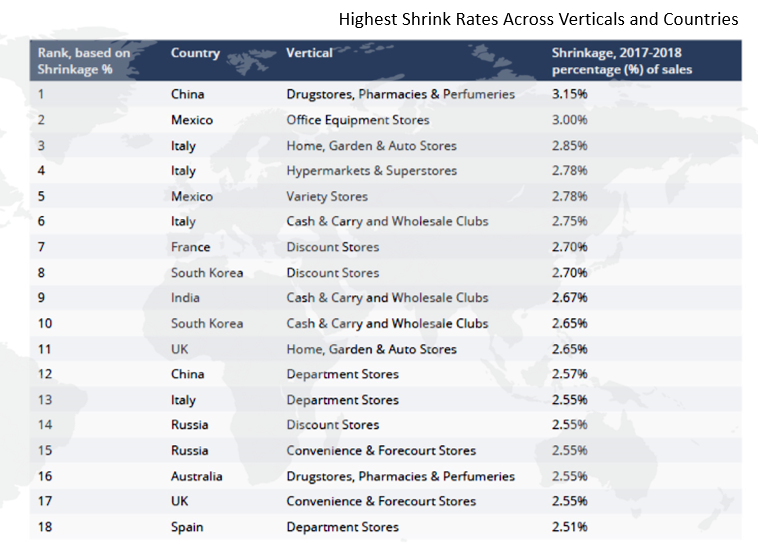
Italy had the highest number of verticals (four) in the top 10% of vertical shrink surveyed across all countries: these included home, garden and auto (2.85%); hypermarkets and superstores (2.78%); cash & carry (2.75%); and, department stores (2.55%).
Surprised by:
- Italy being so prominent in this the top 10% vertical shrink data.
- Each culture seeming to have their own favorite retail shrink target vertical. Note the limited duplication in verticals.
- Multiple other large economies such as Russia, China, UK, South Korea, and Mexico making multiple appearances.
- India which has the second highest shrink in the world and France third, only appearing once on this vertical list.
Not appearing on this chart, but also interesting are the countries reporting shrink rates of less than 1.00% per vertical. These include Indian office equipment (0.95%), German consumer electronics (0.82%), and South Korean fashion and accessories (0.81%) stores. Germany recorded the most vertical categories (5) with below average shrink rates.
Top LP Raw Data Cited by Respondents for Data Mining to Reduce Shrink
Below is a very important chart of the raw data that current loss preventions programs leverage to reduce shrink.
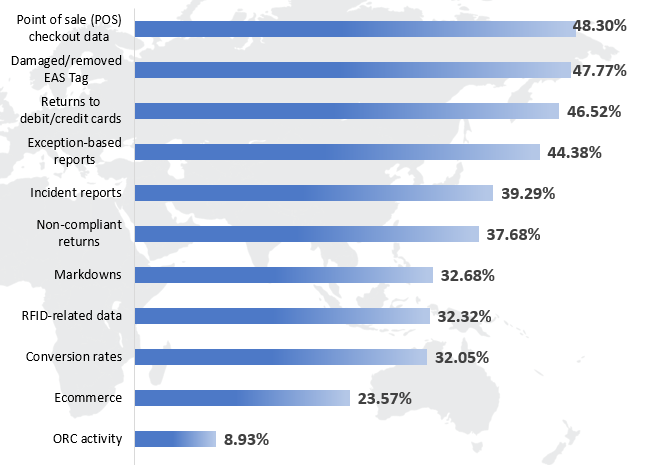
Point of sale being number one was not a surprise. Lots of advanced solutions are already in the market deployed by most retailers. Most of the others were not revolutionary in nature. Almost all look like basics and reflect extensive potential upside in developing raw data for retailers to leverage to reduce shrink.
A few new technologies that will eventually be on this list include social media, video analytics, and GPS tracking solutions. Tracking offenders across Zones of Influence discussed in a previous post also has possibilities.
Of interest are the survey results on social media. Monitoring this new communication channel now seen as the responsibility of the Loss Prevention function for the majority (68.48%) of respondents – notably in Japan (98.02%), Russia (91.67%) and China (91.00%). This function monitors social media platforms for threats to stores (73.40%), merchandise theft/black-market (72.10%), brand protection (64.15%) and potential protest groups/boycotts (54.24%).
Welcome to Retail Shrink Reporting Week
North America individuals can download the 2018 Sensormatic Retail Shrink Index at this LINK. For the rest of the world, try the same link and if you are unable to download the report contact Tyco Retail Solutions.
This week, across all my social media platforms, look for multiple other retail loss prevention insights and studies on a daily basis.